Pokemon Card Population Report Guide: Rarity Analysis 2026
Pokemon Price Tracker
Pokemon Card Population Report Guide: Rarity Analysis 2026
In the Pokemon TCG market, understanding population reports is the difference between making informed collecting decisions and flying blind. With PSA alone having graded over 100 million cards and the market experiencing significant shifts in 2026, knowing how to read and interpret population data has never been more critical.
Population reports reveal the true scarcity of graded cards—information that directly impacts value, investment potential, and collecting strategy. Whether you're considering a vintage Base Set Charizard or a modern chase card, population data tells you exactly how rare your card is compared to every other graded copy in existence.
This comprehensive guide will teach you how to navigate population reports, interpret the data, and use this information to make smarter collecting and investment decisions in 2026's evolving Pokemon card market.
What Is a Pokemon Card Population Report?
A population report is a database maintained by grading companies that tracks every card they've graded, organized by:
- Card name and set
- Grade received (typically 1-10 scale)
- Total population at each grade level
- Cumulative totals across all grades
Think of it as a census for graded cards. When you hear terms like "Pop 1 PSA 10" or "low population gem," collectors are referring to data from these reports.
Why Population Reports Matter
Population data serves several critical functions:
Scarcity Verification: Print runs and pull rates tell part of the story, but population reports reveal how many cards have achieved specific grades. A card might be common in raw form but extremely rare in PSA 10.
Value Assessment: Lower populations at high grades typically command premium prices. A PSA 10 with a population of 5 will generally be worth significantly more than one with a population of 5,000.
Market Timing: Tracking population changes over time reveals grading trends. Rapidly increasing populations can signal oversupply, while stable populations suggest established scarcity.
Grading Difficulty: Comparing populations across grade levels shows how difficult a card is to grade. If a card has 1,000 PSA 9s but only 50 PSA 10s, you know it's challenging to achieve gem mint status.
Major Population Report Resources in 2026
PSA Population Report
PSA remains the market leader with approximately 67% market share in Pokemon card grading. Their population report is the most comprehensive and frequently referenced:
- Updated daily with new submissions
- Searchable by card name, set, and year
- Shows exact counts from PSA 1 through PSA 10
- Includes total graded across all grades
- Free to access without membership
PSA's dominance means their population data has the most significant impact on market values. A PSA 10 typically commands a 10-30% premium over the same card graded by competitors.
CGC Population Report
CGC has rapidly gained market share since entering the Pokemon market:
- Organized by game, era, and set
- Known for stricter grading standards
- Growing database with increasing relevance
- Often shows lower populations due to newer entry
- Particularly popular for modern cards
BGS Population Report
Beckett Grading Services offers unique features:
- Includes subgrades for centering, corners, edges, and surface
- BGS Black Label 10 (Pristine) is extremely rare
- BGS 10 Pristine and 9.5 Gem Mint are highly sought grades
- Stricter standards than PSA historically
- Commands premiums for certain modern cards
Third-Party Aggregators
GemRate.com provides a universal population report combining data from PSA, BGS, SGC, and CGC. This cross-company view helps collectors understand total market supply across all major grading companies.
PokéMetrics.org offers an enhanced interface for PSA data, revealing population changes over time—crucial for identifying grading trends and market saturation.
For comprehensive population tracking across multiple grading companies, check the population data tools available on PokemonPriceTracker.com.
How to Read and Interpret Population Data
Understanding the Numbers
Let's examine a hypothetical population report entry:
1999 Base Set Charizard #4 (Shadowless)
- PSA 1: 45
- PSA 2: 78
- PSA 3: 156
- PSA 4: 289
- PSA 5: 445
- PSA 6: 623
- PSA 7: 891
- PSA 8: 1,234
- PSA 9: 2,567
- PSA 10: 486
- Total Graded: 6,814
Key Insights from This Data
Grade Distribution: The bell curve peaks at PSA 8-9, which is typical for vintage cards. This shows the card's condition sensitivity.
PSA 10 Rarity: Only 7.1% of graded copies achieved gem mint status (486 out of 6,814). This relative scarcity drives premium pricing.
Low-Grade Population: The presence of low-grade copies (PSA 1-4) indicates the card's age and the challenges of preservation over 27 years.
Grading Difficulty: The sharp drop from PSA 9 (2,567) to PSA 10 (486) reveals how difficult this card is to grade at the highest level.
Population Thresholds and Rarity Tiers
While context matters, general population thresholds help assess rarity:
Ultra-Rare (Pop 1-10)
- Extremely scarce
- Often command significant premiums
- Vulnerable to population increases
- Most common with vintage cards or error variants
Very Rare (Pop 11-50)
- Established scarcity
- Strong investment potential if demand exists
- More stable than ultra-rare populations
- Common for high-grade vintage holos
Rare (Pop 51-200)
- Limited supply with growing stability
- Balanced scarcity for serious collectors
- Less vulnerable to dramatic population changes
Moderate (Pop 201-1,000)
- Accessible to dedicated collectors
- Prices more influenced by demand than scarcity
- Typical for popular modern cards in PSA 10
Common (Pop 1,000+)
- Widely available in graded form
- Value driven primarily by demand and card significance
- Standard for modern chase cards and reprints
Population Analysis Strategies
The PSA 10 Rate
Calculate the PSA 10 rate by dividing PSA 10 population by total graded:
PSA 10 Rate = (PSA 10 Population ÷ Total Graded) × 100
Cards with PSA 10 rates below 10% are considered difficult to grade. Rates below 5% indicate extreme grading difficulty and potential value premiums.
Comparing Modern vs. Vintage
Modern cards (2020-2026) typically show:
- Higher PSA 10 rates (15-40%)
- Larger total populations
- More concentrated at high grades
- Greater vulnerability to population growth
Vintage cards (1999-2003) typically show:
- Lower PSA 10 rates (3-15%)
- More distributed across grade levels
- Established populations with slower growth
- Greater long-term stability
Population Trends Over Time
Monitoring population changes reveals critical market dynamics:
Rapid Growth (>20% annually): Indicates active grading, potential oversupply concerns, and possible price pressure. Common with newly released sets.
Steady Growth (5-20% annually): Healthy grading activity with balanced supply. Typical for established modern cards.
Slow Growth (<5% annually): Mature population with limited new submissions. Common for vintage cards where most gradeable copies have been submitted.
Stagnant Growth (<1% annually): Population ceiling reached. Most cards that will be graded have been graded.
Case Studies: Population Impact on Value
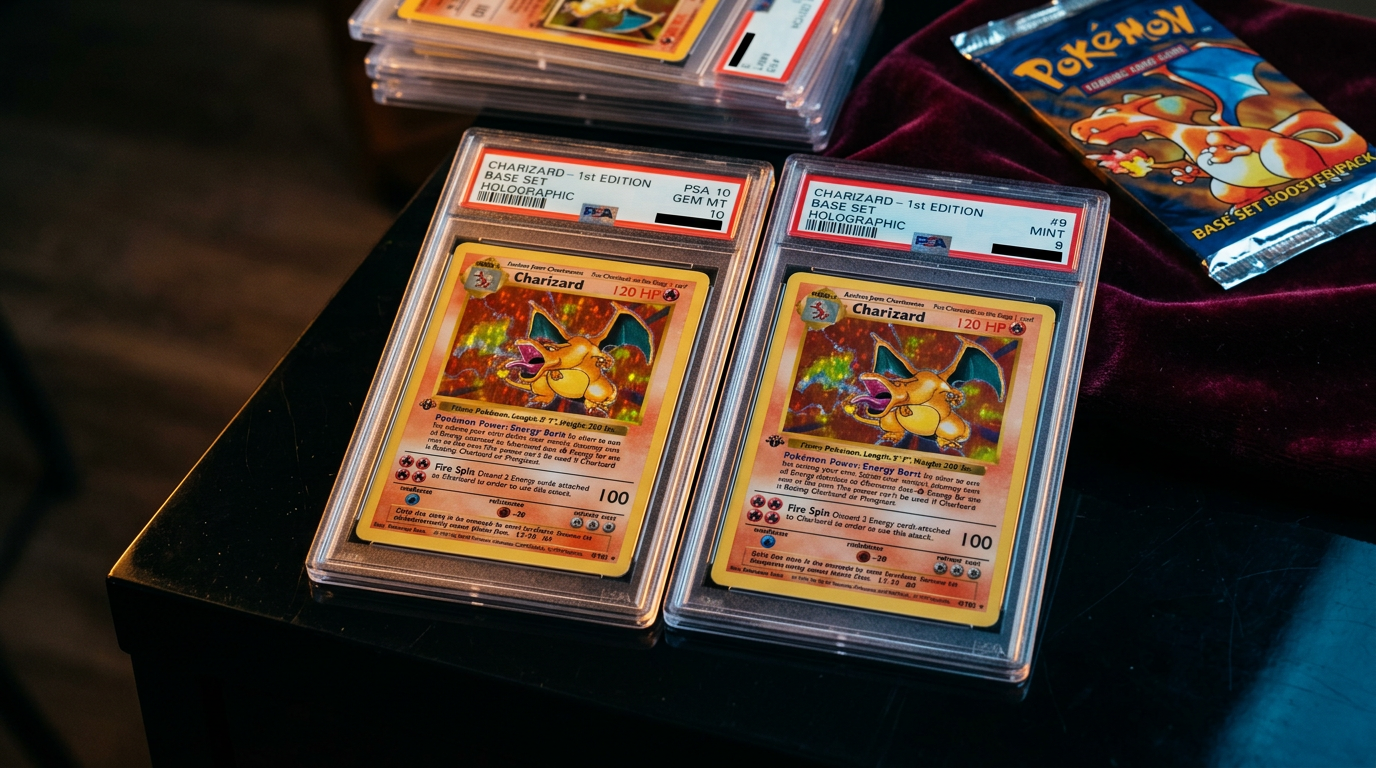
Case Study 1: Base Set Charizard PSA 10
As of early 2026, the shadowless Base Set Charizard has approximately 486 PSA 10 copies. Despite being one of the most iconic cards ever printed:
- The 7.1% PSA 10 rate demonstrates grading difficulty
- Population has grown only 3-4% annually since 2020
- Values have stabilized in the $15,000-25,000 range
- Low population growth supports long-term value retention
Case Study 2: Modern Alt Art Explosion
The Evolving Skies Umbreon VMAX Alternate Art shows different dynamics:
- PSA 10 population exceeded 3,000 by 2026
- PSA 10 rate of approximately 35% indicates easier grading
- Population grew 40% in 2025 alone
- Prices declined 30-40% as population expanded
- Demonstrates modern card vulnerability to oversupply
Case Study 3: Gold Star Pokemon
Gold Star cards from the EX era (2004-2007) represent ideal population characteristics:
- Most have PSA 10 populations under 200
- PSA 10 rates typically 8-12%
- Populations growing only 2-3% annually
- Prices appreciated 30-50% heading into 2026
- Balance of scarcity and established demand
Using Population Data for Investment Decisions
Note: Past performance does not guarantee future results. Always do your own research before making investment decisions.
Red Flags in Population Reports
Inverted Grade Distribution: When PSA 10 population exceeds PSA 9, it often indicates:
- Cracking and resubmission of PSA 9s
- Selective grading (only near-mint cards submitted)
- Potential for population growth as more raw cards are graded
Explosive Population Growth: Cards with populations growing >50% annually face:
- Oversupply risk
- Downward price pressure
- Speculative rather than collector-driven demand
Extremely Low Populations (<5): While appealing, ultra-low populations present risks:
- Vulnerable to significant percentage increases
- One new PSA 10 doubles a Pop 1 card
- May indicate lack of demand rather than true scarcity
Green Flags in Population Reports
Stable, Low Populations: Cards with established populations under 200 and growth under 10% annually often represent solid opportunities.
Low PSA 10 Rates: Cards with PSA 10 rates under 8% have demonstrated grading difficulty, supporting value premiums.
Balanced Demand: When prices remain stable or appreciate despite moderate population growth, it indicates healthy collector demand.
Advanced Population Analysis Techniques
Cross-Company Comparison
Comparing populations across grading companies reveals market preferences:
PSA-Heavy Cards: When PSA population significantly exceeds other companies, it indicates:
- PSA premium is established and recognized
- Market preference for PSA holders
- Potential value gap between PSA and competitors
BGS-Competitive Cards: Modern cards sometimes show competitive BGS populations, suggesting:
- Subgrade appeal for high-end collectors
- Potential BGS 10 Pristine opportunities
- More balanced market between graders
Set Population Analysis
Analyzing entire set populations provides context:
High-Pop Sets: Modern sets with 100,000+ total graded cards face:
- Greater supply across all chase cards
- Price compression over time
- Need for exceptional cards to maintain value
Low-Pop Sets: Vintage sets with limited grading activity show:
- Scarcity premium across all cards
- Stronger value retention
- Greater upside for newly graded high-grade cards
The Population-to-Print-Run Ratio
Estimating what percentage of printed cards have been graded reveals market dynamics:
High Grading Rate (>5%): Indicates:
- Strong collector interest
- Most high-grade copies likely identified
- Mature market with established values
Low Grading Rate (<1%): Suggests:
- Untapped supply in raw form
- Potential for population growth
- Greater uncertainty in true scarcity
Common Population Report Mistakes
Mistake #1: Ignoring Total Context
A PSA 10 population of 100 means different things for:
- A card from a 2026 set (potentially very high, more to come)
- A card from 1999 (established scarcity, stable)
Always consider the card's age, set size, and historical grading trends.
Mistake #2: Focusing Only on PSA 10
The entire grade distribution matters. A card with 1,000 PSA 9s and 50 PSA 10s tells you:
- The card grades well overall (not condition-sensitive)
- Achieving PSA 10 is challenging
- Strong PSA 9 supply may limit PSA 10 premiums
Mistake #3: Assuming Low Population = High Value
Scarcity without demand doesn't create value. Some cards have low populations because:
- Few people submit them (lack of interest)
- The card isn't desirable (unpopular Pokemon, set, or artwork)
- Raw copies are more valuable (population ceiling)
Mistake #4: Ignoring Population Velocity
A stable population of 200 is very different from a rapidly growing population currently at 200. Always check historical data to understand trends.
Population Reports and Grading Decisions
Population data should inform your grading strategy:
When Population Suggests Grading
Low PSA 10 Rate + High Demand: Cards that are difficult to grade but highly sought create optimal grading opportunities. The scarcity premium often exceeds grading costs.
Stable Populations: When populations haven't grown significantly in years, submitting high-grade raw copies can add newly scarce supply to an established market.
Strong Grade Premiums: If PSA 10 commands 3-5x the PSA 9 price and the PSA 10 rate is under 15%, grading near-mint copies offers favorable risk-reward.
When Population Suggests Caution
Rapid Population Growth: If a card's population has doubled in the past year, newly graded copies may face declining values.
High PSA 10 Rates: Cards with PSA 10 rates above 30% offer limited scarcity premium, making grading costs harder to justify.
Inverted Distributions: When PSA 10 population exceeds PSA 9, it suggests aggressive resubmission activity and potential oversupply.
The Future of Population Reports in 2026
Several trends are shaping how collectors use population data:
Increased Transparency
Third-party tools like GemRate and PokéMetrics provide better historical tracking and cross-company comparisons, making population analysis more accessible.
AI-Powered Analysis
Emerging tools use machine learning to predict population growth rates and identify undervalued cards based on population trends.
Real-Time Updates
Grading companies are moving toward real-time population updates, allowing collectors to track changes daily rather than monthly.
Cross-Market Comparisons
Collectors increasingly compare Pokemon populations to other TCGs (Magic: The Gathering, Yu-Gi-Oh!) to identify relative value opportunities.
Practical Tips for Using Population Reports
Building a Population Tracking System
- Identify Target Cards: Create a watchlist of cards you collect or invest in
- Record Baseline Data: Document current populations across all grades
- Set Review Schedule: Check populations monthly or quarterly
- Track Percentage Changes: Calculate growth rates to identify trends
- Compare to Price Data: Correlate population changes with market values
Questions to Ask When Reviewing Population Data
- What is the PSA 10 rate, and how does it compare to similar cards?
- How has the population changed over the past 1-2 years?
- What percentage of the total population is PSA 9 or higher?
- How does this card's population compare to others in the same set?
- Are populations growing faster or slower than price appreciation?
Integrating Population Data with Other Metrics
Combine with Sales Data: Population reports show supply; recent sales show demand. Together, they reveal market health.
Consider Print Runs: A population of 500 PSA 10s means different things for a card with 1,000 printed vs. 100,000 printed.
Factor in Reprint Risk: Modern cards face reprint potential, which could dramatically increase future populations.
Key Takeaways
Population reports are essential tools for serious Pokemon card collectors and investors:
-
Population data reveals true scarcity by showing exactly how many graded copies exist at each grade level
-
Low populations at high grades typically command premium prices, but scarcity alone doesn't guarantee value
-
PSA remains the market leader with the most comprehensive population data and strongest impact on values
-
Monitor population trends over time to identify oversupply risks and stable investment opportunities
-
Calculate PSA 10 rates to understand grading difficulty and potential value premiums
-
Modern cards face greater population growth risk compared to vintage cards with established populations
-
Use population data to inform grading decisions, focusing on cards with low PSA 10 rates and strong demand
-
Cross-reference multiple sources including PSA, CGC, BGS, and aggregators like GemRate for complete market understanding
-
Consider total context including card age, set popularity, and historical grading trends when interpreting population numbers
-
Combine population analysis with price data and market trends for comprehensive investment decisions
Understanding population reports transforms you from a casual collector into an informed market participant. In 2026's evolving Pokemon TCG landscape, this knowledge is more valuable than ever. Whether you're hunting vintage gems or navigating modern releases, population data provides the objective scarcity metrics needed to make confident collecting and investment decisions.
Remember: population reports are tools, not crystal balls. Use them alongside other research, personal collecting goals, and market awareness to build a collection or portfolio that aligns with your objectives. The most successful collectors combine population analysis with passion for the hobby and patience for long-term results.
Tags:
Pokemon Price Tracker
Market Analyst
Related Articles
PSA 10 vs PSA 9: Is the Price Gap Worth It in 2026?
PSA 10 vs PSA 9 premiums have split into two very different markets in 2026. Vintage WOTC cards still command 5-20x multipliers, while modern cards have compressed to 1.3-2.5x. Here's how to decide which grade is worth the price — and when grading makes sense at all.
Pokemon Price Tracker

Pokemon Card Market Crash 2026: Signs & How to Prepare
Is the Pokemon card market crashing in 2026? Modern cards are down 20-45% and sealed products are sliding, but vintage cards keep setting records. Here's how to read the signs and protect your collection.
Pokemon Price Tracker

Top 10 Pokemon Booster Boxes to Buy in 2026
Discover the top 10 Pokemon booster boxes to buy in 2026, from blue-chip Evolving Skies to anniversary Mega Evolution releases. Data-driven analysis of chase cards, projected appreciation, and portfolio strategy for sealed Pokemon investors.
Pokemon Price Tracker
Stay Updated
Subscribe to our newsletter for the latest Pokemon card market trends, investment opportunities, and exclusive insights delivered straight to your inbox.